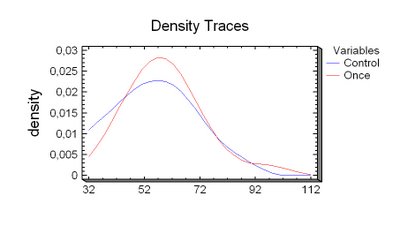
Comparación Prueba Inicial
 El presente gráfico es una comparación de los resultados obtenidos, por el grupo experimental (Once)y el de control, en la prueba de comprensión lectora. Hacemos por tanto un análisis de la Hipótesis Nula y encontramos que ésta no puede ser rechazada, lo cual nos indica que las dos poblaciones no presentan, previamente al desarrollo del Programa Experimental de Ruven Feuerstein, alguna diferencia estadísticamente significativa a un nivel de confianza de 95%.
El siguiente es el resultado del Análisis de Hipótesis obtenido con el software Statgraphics Versión 5.10.
Hypothesis Tests for Control-Once
Sample mean = -4,47133
Sample median = -0,36
t-test
------
Null hypothesis: mean = 0,0
Alternative: not equal
Computed t statistic = -1,13024
P-Value = 0,277366
Do not reject the null hypothesis for alpha = 0,05.
sign test
---------
Null hypothesis: median = 0,0
Alternative: not equal
Number of values below hypothesized median: 8
Number of values above hypothesized median: 7
Large sample test statistic = 0,0 (continuity correction applied)
P-Value = 0,999994
Do not reject the null hypothesis for alpha = 0,05.
signed rank test
----------------
Null hypothesis: median = 0,0
Alternative: not equal
Average rank of values below hypothesized median: 9,375
Average rank of values above hypothesized median: 6,42857
Large sample test statistic = 0,823545 (continuity correction applied)
P-Value = 0,410196
Do not reject the null hypothesis for alpha = 0,05.


0 Comments:
Publicar un comentario
<< Home