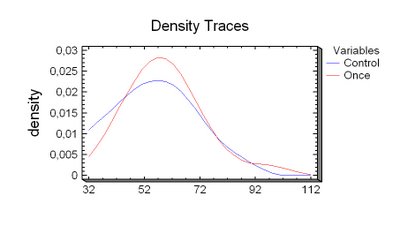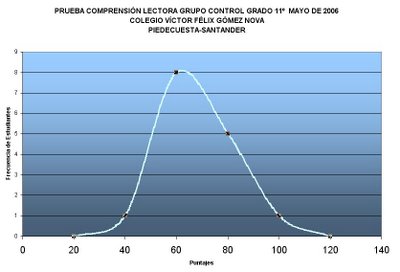
El presente gráfico es una comparación de los resultados obtenidos, por el grupo experimental (
Once)y el de control, en la prueba de comprensión lectora. Hacemos por tanto un análisis de la Hipótesis Nula y encontramos que ésta no puede ser rechazada, lo cual nos indica que las dos poblaciones no presentan, previamente al desarrollo del Programa Experimental de Ruven Feuerstein, alguna diferencia estadísticamente significativa a un nivel de confianza de 95%.
El siguiente es el resultado del Análisis de Hipótesis obtenido con el software Statgraphics Versión 5.10.
Hypothesis Tests for Control-OnceSample mean = -4,47133
Sample median = -0,36
t-test
------
Null hypothesis: mean = 0,0
Alternative: not equal
Computed t statistic = -1,13024
P-Value = 0,277366
Do not reject the null hypothesis for alpha = 0,05.sign test
---------
Null hypothesis: median = 0,0
Alternative: not equal
Number of values below hypothesized median: 8
Number of values above hypothesized median: 7
Large sample test statistic = 0,0 (continuity correction applied)
P-Value = 0,999994
Do not reject the null hypothesis for alpha = 0,05.signed rank test
----------------
Null hypothesis: median = 0,0
Alternative: not equal
Average rank of values below hypothesized median: 9,375
Average rank of values above hypothesized median: 6,42857
Large sample test statistic = 0,823545 (continuity correction applied)
P-Value = 0,410196
Do not reject the null hypothesis for alpha = 0,05.


